Why Project Profitability Feels Like a Gamble
Every contractor faces the same dilemma: How do you bid low enough to win but high enough to make a profit? Too many projects fall into the trap of being 'successful' on paper but unprofitable in reality. And let’s face it, guessing isn’t a strategy.
That’s where the Project Profitability Index (PI) formula comes in. It’s a straightforward way to assess whether a project is worth your time and resources. But here’s the catch—most contractors don’t use it. Instead, they rely on gut instincts or outdated spreadsheets, which are riddled with errors and lack transparency.
In this post, we’ll break down the PI formula, show you how to calculate it, and share a practical example of how modern tools can make this process faster and more accurate.
The Project Profitability Index Formula
At its core, the formula is simple:
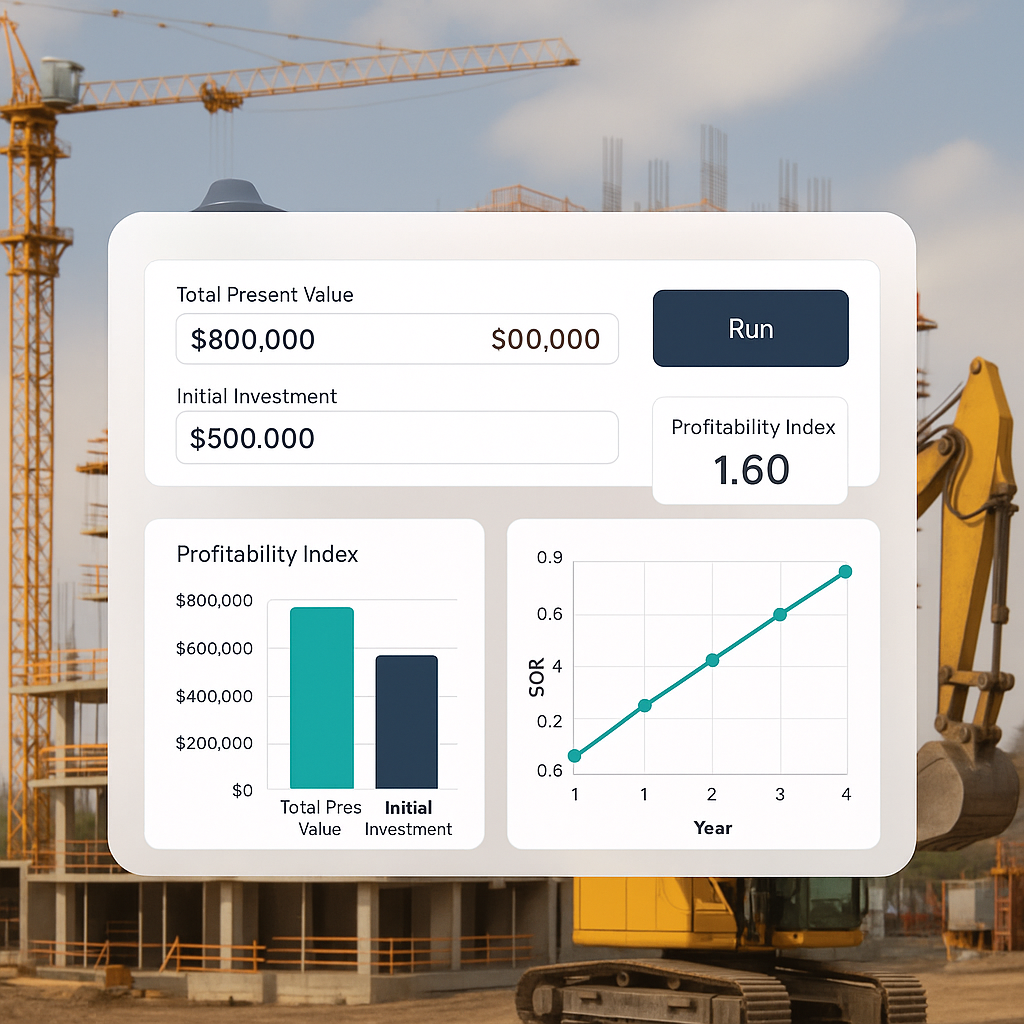
Profitability Index (PI) = Net Present Value (NPV) ÷ Initial Investment
- NPV: This is the net value of all cash inflows and outflows over the project’s lifecycle, discounted to today’s value.
- Initial Investment: This includes all upfront costs like materials, labor, equipment, and any other overheads tied to the project.
A PI greater than 1 indicates the project is profitable. Less than 1? It’s a red flag.
Illustrative example —
- NPV: Based on projected cash flows adjusted for inflation and risk factors.
- Initial Investment: Includes upfront costs like materials, labor, and equipment.
PI = NPV ÷ Initial Investment
If the PI is greater than 1, the project is worth pursuing because it indicates a positive return on investment.
Why Contractors Ignore PI (and Why That’s a Mistake)
Many contractors skip PI analysis because they think it’s too complicated or time-consuming. They’re already swamped with rate lookups, BOQ reviews, and bid coordination. But ignoring PI can lead to massive issues:
- Undervalued Projects: You win the bid but lose money due to underestimated costs.
- Missed Opportunities: Passing on a project that could’ve been highly profitable.
- Cash Flow Strain: Taking on low-PI projects ties up resources that could be better spent elsewhere.
We’ve all seen it happen—projects that look good on paper but end up with razor-thin margins because labor costs or material inflation weren’t factored in accurately.
How Tools Simplify PI Calculations
Here’s where modern tools can come into play. Traditionally, calculating NPV involves:
- Collecting cash flow forecasts
- Adjusting for inflation and market variables
- Manually mapping costs to revenues
This process can be time-consuming. However, platforms that automate these calculations can significantly reduce the effort:
- BOQ Upload: Upload your bill of quantities (even messy Excel files). The system parses it quickly.
- Rate Analysis: Matches BOQ items to standard rates, factoring in inflation and regional costs.
- Profitability Insights: Built-in calculators compare projected cash flows against your initial investment to provide a PI score.
Illustrative example —
A contractor analyzing a mid-size commercial project uploads the BOQ and applies pre-set cost factor profiles (e.g., overhead and profit margins). The tool calculates the PI, helping the contractor decide whether to proceed with the bid confidently.
Steps to Calculate PI for Your Next Project
Even if you don’t have advanced tools, you can calculate the PI manually. Here’s a step-by-step guide:
- Estimate Cash Inflows: Project your revenues based on client payments, milestone schedules, or expected variations.
- Estimate Cash Outflows: Include every cost—materials, labor, equipment, overhead, and contingencies.
- Discount Future Cash Flows: Use a discount rate (often your cost of capital or required ROI) to adjust future cash flows to today’s value. Excel or Google Sheets can help.
- Calculate NPV: Subtract total discounted cash outflows from total discounted inflows.
- Divide by Initial Investment: This gives you the PI score.
Common Mistakes to Avoid
- Ignoring Inflation: Material and labor costs can rise mid-project. Always factor in a buffer.
- Overestimating Revenues: Be conservative with revenue projections. Clients may delay payments.
- Underestimating Contingencies: Scope creep and unforeseen issues can eat into margins fast.
- Relying on Gut Feel: If you’re not calculating PI, you’re guessing—and that’s expensive.
- Skipping Small Projects: Even smaller projects can be profitable if the PI is solid. Don’t dismiss them based on size alone.
FAQ
Q: What’s a good PI score?
A PI above 1 is generally good, but higher is better. For example, a PI of 1.5 means you earn ₹1.50 for every ₹1 invested.
Q: How do I choose the right discount rate?
Use your cost of capital or required ROI. For government projects, check guidelines—they often specify a standard rate.
Q: What if I don’t have historical data for cash flows?
Start with industry benchmarks or historical data from similar projects. Tools that aggregate market data can also help fill in gaps.
The Bottom Line
Calculating the Project Profitability Index isn’t optional. It’s essential for making informed bid decisions and protecting your margins. Modern tools can simplify this process, saving you time and reducing errors.
If you’re tired of guessing your way through bids, consider leveraging technology to streamline your calculations and improve your decision-making.