How to Create a Practical Project Profitability Report Template for Construction
If you’re managing construction projects, you know this truth: profits don’t just vanish—they leak. Without a clear view of where money is being spent, where margins are being squeezed, and where overruns are coming from, you’re flying blind. The result? Your bottom line takes a hit, and you don’t even know what caused it.
That’s where a project profitability report comes in. But let’s be real—most templates floating around online are either too generic or too complicated to use. What you need is something actionable: a template that tracks key metrics, flags issues early, and provides a clear financial picture of your project.
Here’s how to build one, step by step.
1. Start with Key Metrics That Matter
Not every number is worth tracking. Focus on metrics that directly impact your project’s financial performance. Here are the essential ones:
- Revenue: Total contract value, including any change orders and variations. This is the income you expect to generate from the project.
- Direct Costs: Materials, labor, equipment—line items that directly tie to project activities. These costs are directly proportional to construction progress.
- Overheads: Indirect costs like site office expenses, management salaries, utilities, insurance, and permits. Often overlooked, overheads can erode profits significantly.
- Profit Margin: The percentage left after all expenses are accounted for. This metric tells you if the project is financially viable.
Actionable Steps: Break Down Costs by Trade
A generic cost breakdown won’t cut it. Separate costs by trade—civil, electrical, plumbing, etc.—to see which ones are driving overruns. For example, tracking labor costs for electrical works separately can reveal inefficiencies or delays within that specific trade.
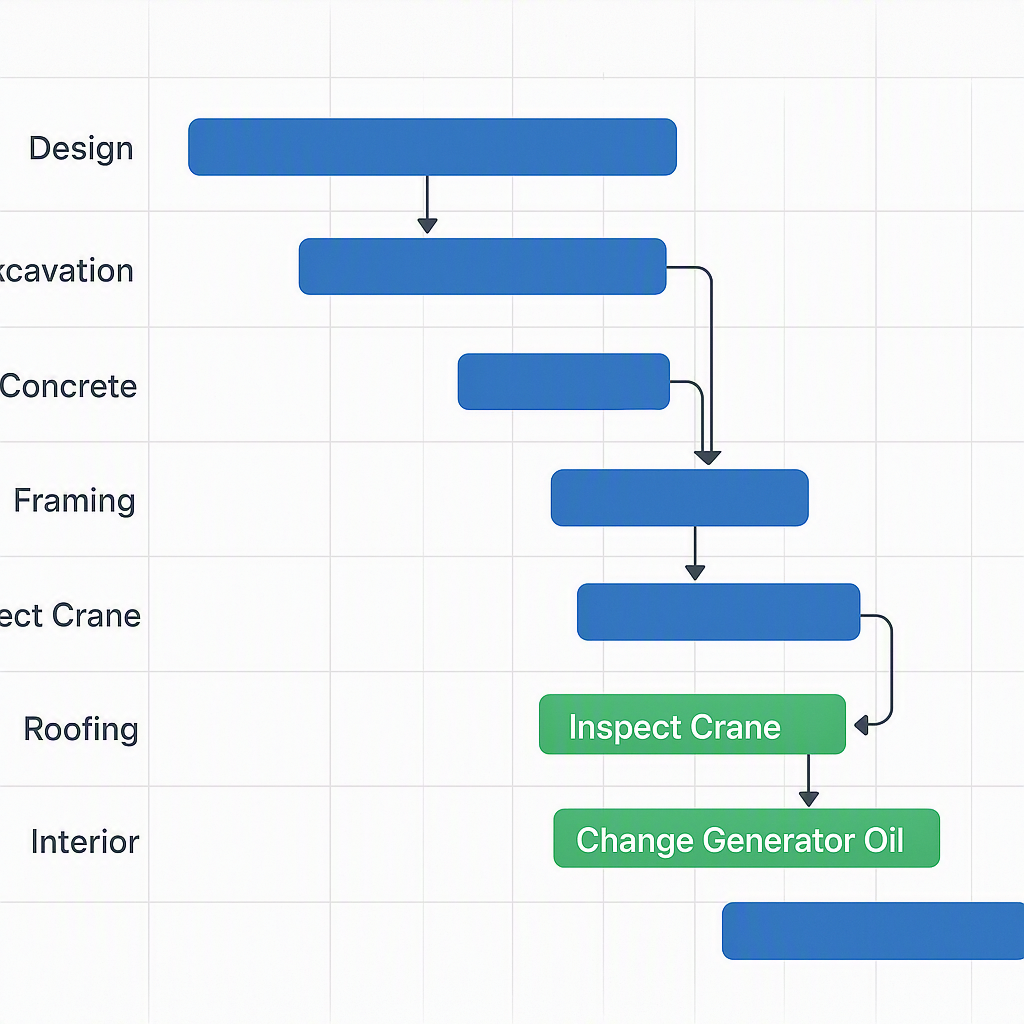
Tools like EstimateNext allow you to generate trade-wise Gantt charts and even forecast cash flow for each trade. This level of granularity helps you pinpoint problem areas faster, enabling quicker corrective actions.
2. Use a Simple, Clear Structure
Complicated templates lose their utility fast. Keep it simple and focused so it’s easy to interpret at a glance. A table format works best:
| Category | Planned | Actual | Variance | % Variance |
|---|---|---|---|---|
| Revenue | ₹10,00,000 | ₹9,80,000 | ₹-20,000 | -2% |
| Materials | ₹3,50,000 | ₹3,80,000 | ₹30,000 | +8.5% |
| Labor | ₹2,00,000 | ₹2,25,000 | ₹25,000 | +12.5% |
| Equipment | ₹50,000 | ₹47,000 | ₹-3,000 | -6% |
| Overheads | ₹1,00,000 | ₹1,10,000 | ₹10,000 | +10% |
| Profit Margin | ₹3,00,000 | ₹2,18,000 | ₹-82,000 | -27% |
Illustrative example—replace placeholder values with real project data.
This design ensures you can instantly spot where the biggest variances are happening. Highlight rows with significant discrepancies to draw attention to priority areas.
Pro Tip: Add Columns for Project Phases
Breaking down your profitability by project phase—planning, execution, and closeout—provides even deeper insights. For example, overruns in planning might indicate poor estimation practices.
3. Include a Variance Analysis Section
Numbers alone don’t tell you anything unless you analyze them. Add a section that explains:
- Why variances occurred: Was it a spike in steel prices? Unplanned overtime? Poor subcontractor performance? Identifying root causes is critical to avoiding similar issues in future projects.
- What to do about it: Adjust procurement timelines? Negotiate with suppliers? Cut non-essential expenses?
Example Method: Tackling Labor Cost Overruns
If you notice a 12.5% increase in labor costs, it could be due to extended work hours caused by poor scheduling. A tool like EstimateNext can help by syncing your Bill of Quantities (BOQ) with project schedules, identifying delays early, and recalculating costs in real-time.
4. Incorporate Real-Time Cost Tracking
Static templates are fine for post-project reviews, but they don’t help you during execution. Real-time tracking is essential for staying proactive.
How Can You Achieve This?
- Automated Rate Updates: Use tools that pull live material and labor rates. For example, EstimateNext’s Market Prices feature keeps your rate library updated with local pricing trends.
- Daily Cost Logging: Implement a simple process for site managers to log daily costs into your system—whether through Excel sheets, a mobile app, or an ERP software.
- AI-Powered Insights: Platforms like EstimateNext can flag unusual variances (e.g., a sudden spike in concrete costs) and suggest corrective actions to avoid further damage.
5. Visualize Data for Better Decisions
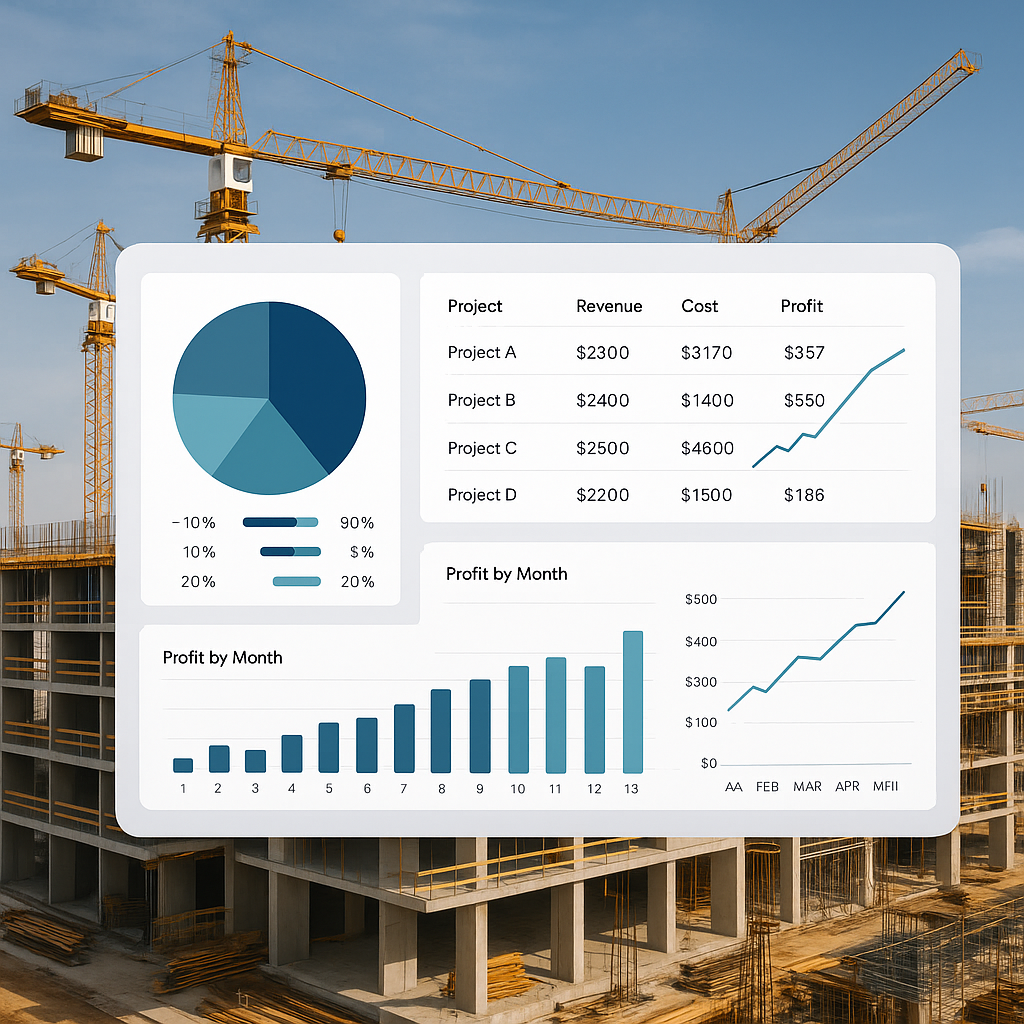
Don’t just rely on tables. Add charts and graphs to make data easier to digest. Visualizations help stakeholders quickly grasp complex trends and make informed decisions.
Key Visualizations to Include:
- S-Curve for Cash Flow: This shows planned vs. actual cash flow over time, helping you spot trends and deviations.
- Profit Margin Trends: A line graph that tracks margin erosion as the project progresses.
- Trade-Wise Cost Pie Chart: Instantly see which trade is eating up most of your budget.
Most modern project management tools, such as EstimateNext, can generate these visuals automatically and export them for presentations or reports.
6. Don’t Forget Risk Adjustments
Every construction project has risks—material price volatility, weather delays, labor shortages, etc. Your template should include a section for:
- Identified Risks: List key risks and their likelihood.
- Financial Impact: Estimate the potential cost impact if the risk materializes.
- Mitigation Actions: Describe steps to minimize these risks, such as locking in material rates early or hiring backup labor teams.
Worked Example: Steel Price Volatility
If steel prices are volatile, you might decide to lock in rates with suppliers early. Alternatively, you could hedge by ordering materials in smaller batches but at staggered intervals. EstimateNext’s AI-driven rate analysis can simulate various scenarios and their financial outcomes before you commit.
7. Review and Iterate
No template is perfect out of the box. After using it on a few projects, take time to:
- Identify any missing metrics or sections.
- Fine-tune the layout based on usability feedback.
- Gather input from site managers, finance teams, and other stakeholders.
Actionable Step: Schedule Template Reviews
Include template reviews in your quarterly team meetings. This ensures the document evolves alongside your business needs.
Common Mistakes to Avoid
- Overcomplicating the Template: If it takes hours to fill out, nobody will use it.
- Ignoring Indirect Costs: Overheads can sink your margins if you’re not tracking them properly.
- Skipping Risk Analysis: This leaves you exposed to surprises like material price hikes.
- Delaying Updates: Profitability reports should be updated regularly, not just at project close.
- Relying Solely on Gut Feel: Back up your decisions with data, not intuition.
FAQ
1. How often should I update the profitability report? Weekly updates during active construction are ideal. If your project has tight margins, daily updates may be more effective to catch issues early.
2. What tools can help automate profitability reports? EstimateNext is one option that integrates rate analysis, BOQ tracking, and cash flow forecasting into one platform. Other tools include Procore and Buildertrend.
3. Can I use this for small projects? Absolutely. The same principles apply, though smaller projects might require simpler templates with fewer metrics.
4. How do I handle incomplete data? Start with what you have and refine it over time. Use placeholders for missing data but flag them clearly to avoid confusion.
5. What’s the biggest benefit of a well-designed template? It helps you avoid overruns, protect your margins, and make data-driven decisions that can save you money and improve efficiency.
Ready to Simplify Profitability Tracking?
If tracking your project’s financial performance feels like a guessing game, EstimateNext can help. From BOQ parsing to real-time cost insights, it’s built for construction pros who need answers fast. Get started free →